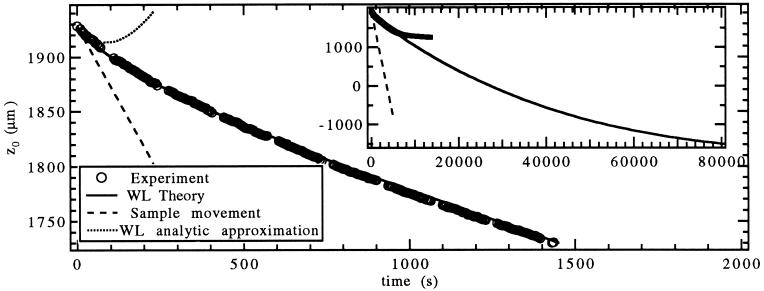
Figure 6.
Interface position z0(t) vs. t of a SCN/C152 sample (V = 0.549 μm/s, G = 20.2 K/cm, C∞ = 0.30 wt%). Comparisons with WL calculation (solid line), WL analytic approximation (dotted line), and sample movement (dashed line) are shown. (Inset) Long-time behavior, where the WL prediction breaks down due to solute trapping.

