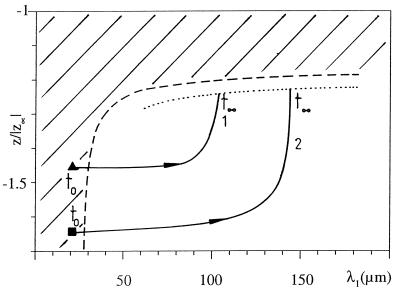
Figure 4.
(Schematic) WL calculation of the dynamics of the tip position as a function of interdendritic spacing. Solid line 1 indicates the trajectory of the planar–dendritic transient. The dashed line denotes the limit of applicability of the theory. The dotted line marks possible-steady state solutions for the dendritic array. Solid line 2 shows another possible trajectory for different z0 and λ0 (adapted from ref. 3).

