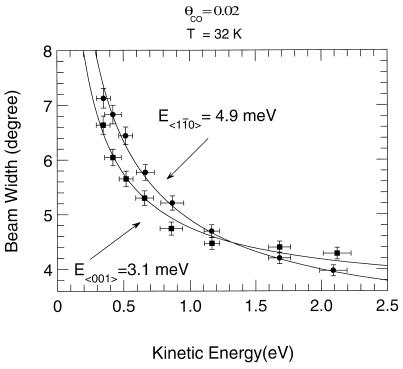
Figure 9.
Fit of the CO* beam width versus translational energy measurements to characteristic FT vibrational energies. The diagram schematically illustrates the FT momenta for CO in the two crystallographic azimuths (9). [Reprinted with permission from ref. 9 (Copyright 1987, American Institute of Physics.)]

