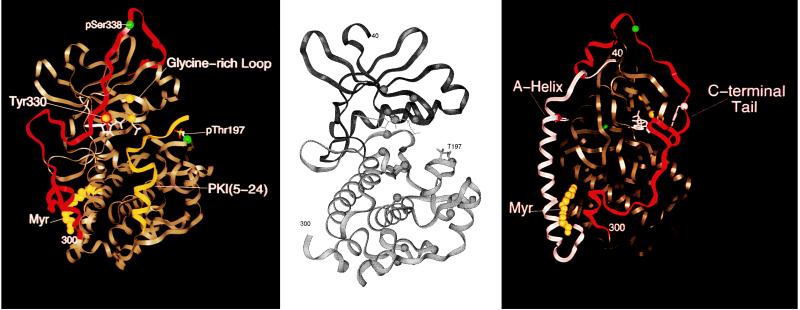
Figure 1.
Ribbon diagram of the catalytic subunit. The conserved core (Center) highlights conserved residues (G50, G52, G55, K72, E91, D166, N171, D184, E208, D220, and R280). The small lobe (residues 40–120) is dark. The nonconserved “head” (residues 1–39; white) and “tail” (residues 300–350; red) are highlighted (Left and Right). The myristyl moiety is yellow, and phosphates (Ser-338 and Thr-197) are green. Side chains of Trp-30 and Tyr-330, two prominent aromatic residues that interact with the core, are shown. The core is tan (Left and Right) with Gly-50, -52, and -55 shown as yellow balls. Center and Left show the same view. (Right) The view is rotated counterclockwise approximately 90°.

