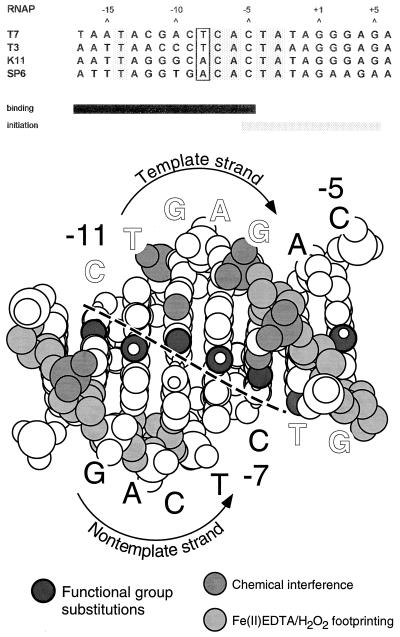
Figure 1.
Promoter structure. (Upper) Alignment of the consensus promoter sequences for T7, T3. K11, and SP6 RNAPs. The sequence of the nontemplate strand is presented; the transcription start site is at +1 (for review, see ref. 3). Positions at which bp are conserved in all phage promoters are shaded; the bases at −8 are enclosed in a box. The solid bar below the sequences denotes the binding region, which is recognized in a double-stranded form; the stippled bar denotes the initiation region, which is thought to be melted open from about −5 to +3 during RNAP binding and initiation (6, 7). (Lower) Summary of promoter recognition contacts (modified from ref. 7; drawing courtesy of Dr. Craig T. Martin). The promoter region from −13 to −5 is modeled as B-form DNA. Sugars protected by bound RNAP in hydroxyl radical footprinting experiments are indicated in light gray (16); guanine N7 and phosphate groups identified by chemical modification interference studies are in medium gray (17); base functional groups identified via incorporation of base analogs are in dark gray (7, 21, 22). A dashed line separates the interface between bases in the template and nontemplate strands.

