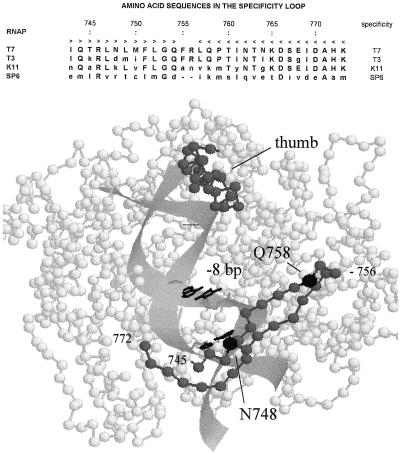
Figure 2.
RNA polymerase structure. (Upper) The amino acid sequences of the T7, T3, K11, and SP6 RNAPs in the region of the specificity loop (T7 residues 742–773) are aligned (31–34); lowercase letters indicate positions where the sequences differ from that of T7, and dashes indicate a gap that has been inserted into the SP6 sequence to optimize the alignment. The arrowheads along the top indicate travel along the loop from the “fingers” wall of the DNA binding cleft to the tip (residue 756) and return. (Lower) The alpha carbon backbone of T7 RNAP is represented as connected spheres (coordinates are from the Brookhaven Protein Databank). Residues 745–772 in the specificity loop (1) and residues 369–390 in the “thumb” motif (35) are shaded in gray. The positions of residues N748 and Q758, which are involved in recognition of the bp at −11 and −8, are indicated in black. Computer modeling of B-form DNA in the binding cleft was carried out as proposed by Patel et al. (28), placing the specificity loop on top of the DNA and residue N748 near the bp at −11. The base pairs at −8 and −11 are depicted in wire frame.

