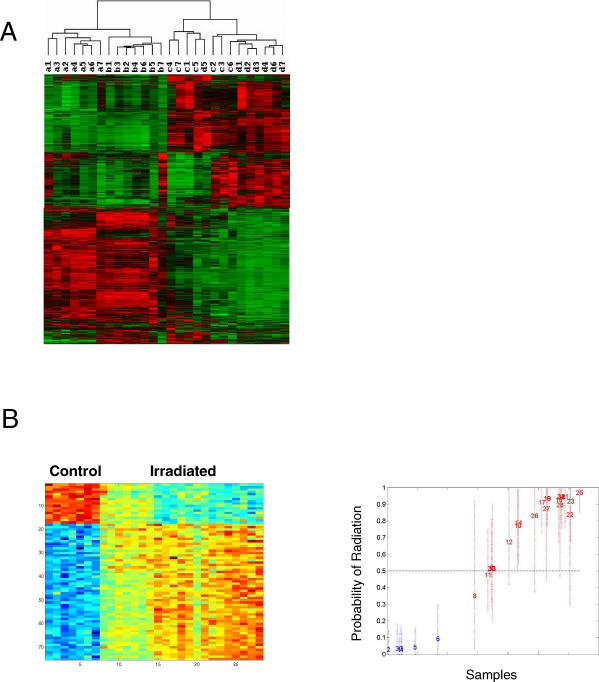
Figure 2. Gene Expression Profiles that Reflect Radiation Exposure.
(A) Clustering of samples based on gene expression patterns reflects radiation exposure. Hierarchical cluster analysis of a filtered list of 2,213 probe sets from expression data of PB MNCs from mice irradiated at varying dosages is shown (a, normal; b, 50 cGy; c, 200 cGy; d, 1,000 cGy). Each gene is represented by a single row, and each sample is represented by a single column. The color red represents expression ratios of overexpressed genes, green represents expression ratios of underexpressed genes, and black represents expression ratio of 0 (similar expression in both samples). The relative expression ranges from 0.02 to 610.
(B) A supervised analysis to identify an expression profile that distinguishes control samples from irradiated samples is shown. On the left, PB MNCs were prepared from either control mice or mice irradiated at the indicated dose. RNA was extracted and used for the synthesis of probes for microarray analysis. The left images depict the expression pattern of genes selected for classifying irradiated samples from control. The expression of genes is standardized to zero mean and unit variance across samples, which are displayed with each row as a gene ordered vertically by the estimated regression weights. Each column is a sample from an independent experiment. High expression is depicted as red, and low expression is depicted as blue, and the range of expression is from 0.02 to 610. The images on the right depict leave-one-out cross validation of the classification probabilities at each dose. Each sample, including the controls and the irradiated samples, is predicted as a probability of exhibiting a gene expression signature reflecting the irradiated sample's specific pattern along with 95% confidence intervals indicated as dashed vertical lines. Each sample is plotted as its predicted probability of radiation response (red) versus nonresponse (blue) on the basis of the analysis of the remaining samples. Each sample is represented as a number in the chronological order of the dose of radiation received; e.g., samples 1–7 are from nonirradiated controls, 8–14 are from 50-cGy irradiated animals, 15–21 are from 200-cGy irradiated animals, and 22–28 are from 100-cGy irradiated animals.

