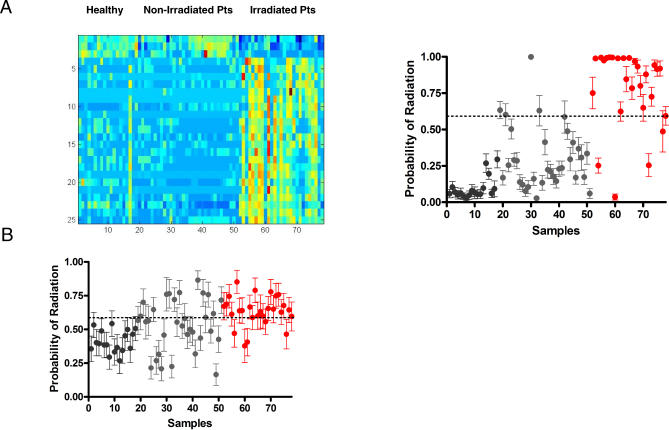
Figure 5. Metagene Profiles Generated in Mice and Humans Can Predict Radiation Exposure.
(A) A metagene profile of human radiation exposure generated in humans is represented. The heatmap on the left depicts the expression profiles of genes (rows) selected to discriminate the human samples (columns); high expression is depicted as red, and low expression is depicted as blue with the relative expression level ranging from 0.06–139.0. Healthy, healthy donors; Non-Irradiated Pts, nonirradiated patients; Irradiated Pts, irradiated patients. In the right image samples from irradiated patients are shown in red, whereas the samples from nonirradiated patients (gray) and healthy donors (black) are shown. The human metagene profile correctly distinguished 90% (85% sensitivity and 94% specificity) of the irradiated human samples versus the nonirradiated human samples.
(B) A metagene profile of human radiation exposure generated in mice is represented. Samples from irradiated patients are shown in red, whereas the samples from nonirradiated patients (gray) and healthy donors (black) are shown. In an external validation study, the metagene profile of 1,000 cGy from the mouse successfully identified 77% (82% sensitivity and 75% specificity) of the irradiated human samples versus the nonirradiated human samples.

