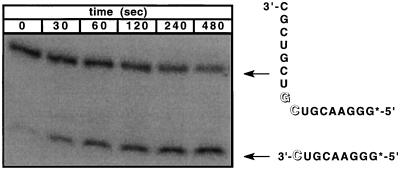
Figure 2.
Gel autoradiogram of the time course of a typical HH16-mediated cleavage reaction with a 5′ end-labeled RNA substrate. The gel bands corresponding to the complex and to the cleaved RNA are indicated at increasing reaction times. These experiments typically resulted in 80–90% cleavage of the substrate over the measured time course of the reaction.

