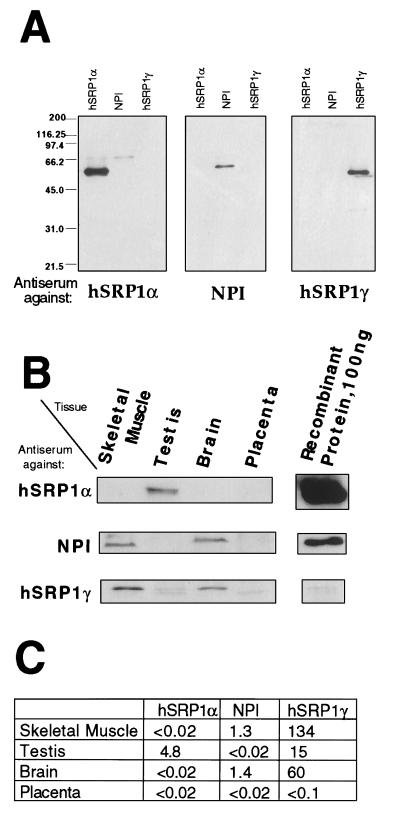
Figure 3.
Protein expression pattern of hSRP1γ, hSRP1α, and NPI/hSRP1 in different human tissues. (A) Specificity of the antisera used in this study. About 500 ng of the indicated recombinant proteins were separated by SDS/PAGE, transferred to nitrocellulose, and subsequently probed with the antiserum against hSRP1α, NPI, or hSRP1γ. (B) Multitissue Western blots probed with the antiserum against hSRP1α, NPI, or hSRP1γ. Five micrograms (hSRP1α, NPI) or 1 μg (hSRP1γ) of tissue protein extracts (CLONTECH) and 50 μg (hSRP1α, NPI) or 10 μg (hSRP1γ) were loaded in the first four lanes. The indicated amount of recombinant protein loaded in the last lane was determined by densitometry scanning in a Coomassie-stained gel. (C) Result of quantitation of protein expression. The values correspond to the amount (in ng) of each importin-α-like factor per 10 μg of total protein.

