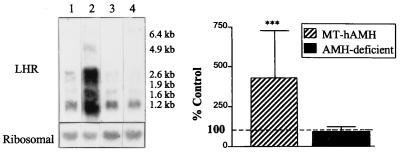
Figure 3.
Expression of LHR mRNA in the testes of transgenic animals. (Left) Northern blot hybridization of LHR probe to testicular RNA. Total RNA samples were 20 μg, exposure was 1 week. 1) normal littermate of MT-hAMH transgenic, 2) MT-hAMH transgenic, 3) normal littermate of AMH-deficient transgenic, and 4) AMH-deficient transgenic. Results shown are representative of those obtained for nine MT-hAMH and five AMH-deficient animals and the same number of normal littermates. (Right) PhosphorImager quantification of LHR transcripts. Results are expressed as mean ± SEM (n = 9 for MT-hAMH and n = 5 for AMH-deficient mice) of percentage of expression relative to a normal littermate (control) analyzed on the same blot. ∗∗∗, P ≤ 0.001.

