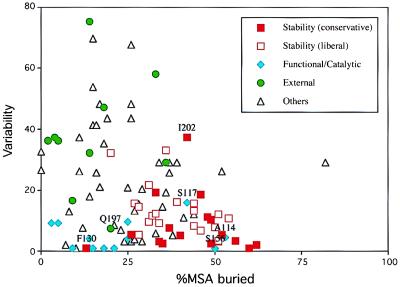
Figure 6.
RT sequence variability vs. percent MSA buried for residues P95 through E203 of the HIV-1 RT 66-kDa subunit. This figure is a scatter graph plotting RT sequence variability (y axis) against percent MSA buried (x axis) for HIV-1 RT residues P95 through E203. The percent MSA buried is for residues in the 66-kDa subunit. Glycine residues are not included. Residues assigned a role from an interpretation of the mutational data are designated as follows: red ▪ (stability), red □ (additional stability residues from a more liberal interpretation of the mutational data), cyan ⧫ (functional/catalytic), and green • (external). Unclassified residues are indicated with black ▵. Residues that fall outside of their predicted region are labeled with their sequence position (functional residues A114, S117, and S156, stability residues F130 and I202, and the external residue Q197).

