
Fig. 5.
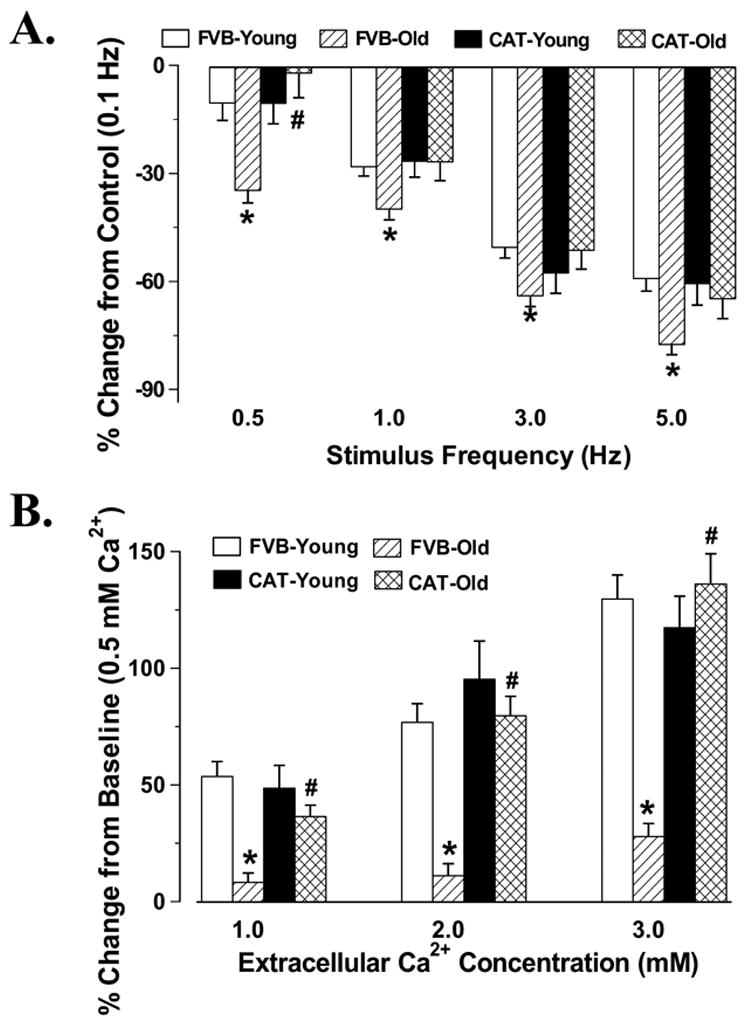
Peak shortening (PS) amplitude of cardiomyocytes from male young or old FVB and catalase (CAT) mice at different stimulus frequencies (Panel A with an extracellular Ca2+ concentration of 1.0 mM) or different extracellular Ca2+ concentrations (Panel B with a stimulus frequency of 0.5 Hz). PS was shown as % change from PS value at respective baseline (0.1 Hz for panel A and 0.5 mM Ca2+ for panel B) of the same cell. Mean ± SEM, n = 26 – 29 cells from 8 mice per group, * p < 0.05 vs. respective young group, # p < 0.05 vs. FVB-old group.