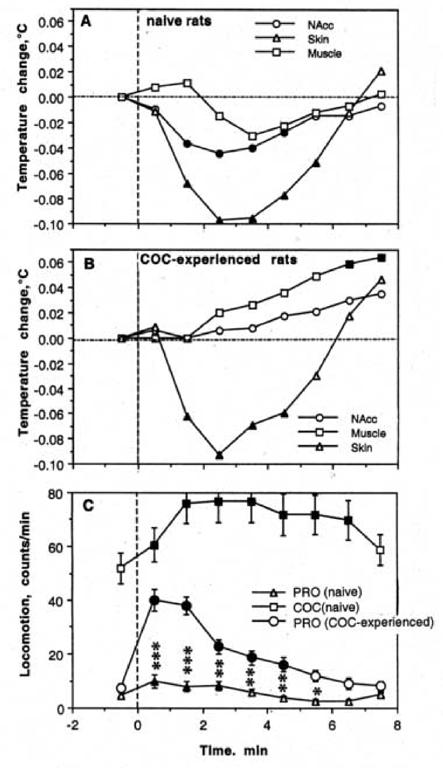
Fig. 10.

Mean changes in temperature (A, B) and locomotion (C) during repeated procaine injections in drug-naive conditions and after cocaine experience. Filled symbols show values significantly different from the pre-injection baseline. Asterisks show between-group differences (procaine in drug-naive vs. cocaine-experienced conditions) in locomotion (*, p<0.05; **, p<0.01, and *** p<0.001; Student’s t-test).
