
Fig. 1. Multiorgan infiltration of activated T cells in NF-κB2−/− mice.
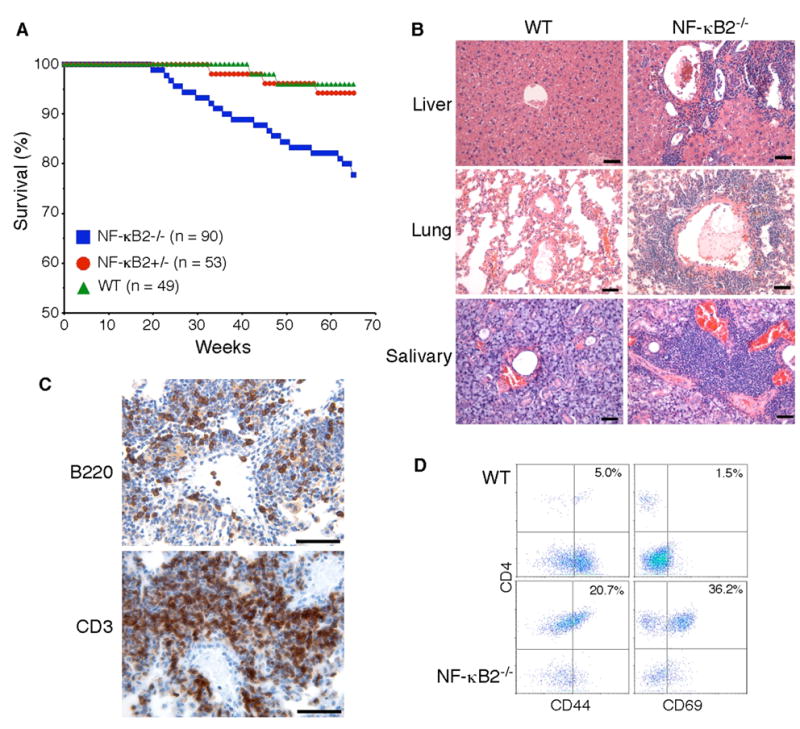
A, Survival curves of NF-κB2−/−, NF-κB2+/− and wild-type mice. Numbers of mice for each genotype are indicated. B, Infiltration of peripheral organs revealed by H&E staining of formalin-fixed sections of the liver, lung, and salivary gland from a 10-month-old NF-κB2−/− mouse, with an age-matched wild-type mouse as control. Scale bars, 100 μm. C, Immunohistochemical staining of formalin-fixed lung sections from a 1-year-old NF-κB2−/− mouse. Most of the infiltrating cells were stained strongly for CD3, a T-cell marker, and a significant number of the infiltrating cells stained positively for B220, a B-cell marker. Data are representatives of 4 mice for each genotype. Scale bars, 100 μm. D, CD4+ T cell infiltrates in the lung of a 1-year-old NF-κB2−/− mouse show increased expression of the memory marker CD44 and the activation marker CD69 in comparison with an age-matched wild-type mouse. Numbers indicate percentages of the gated populations. Data are representatives of 4 mice for each genotype.