
Fig. 5. NF-κB2−/− mice show defects in promiscuous gene expression in the thymus.
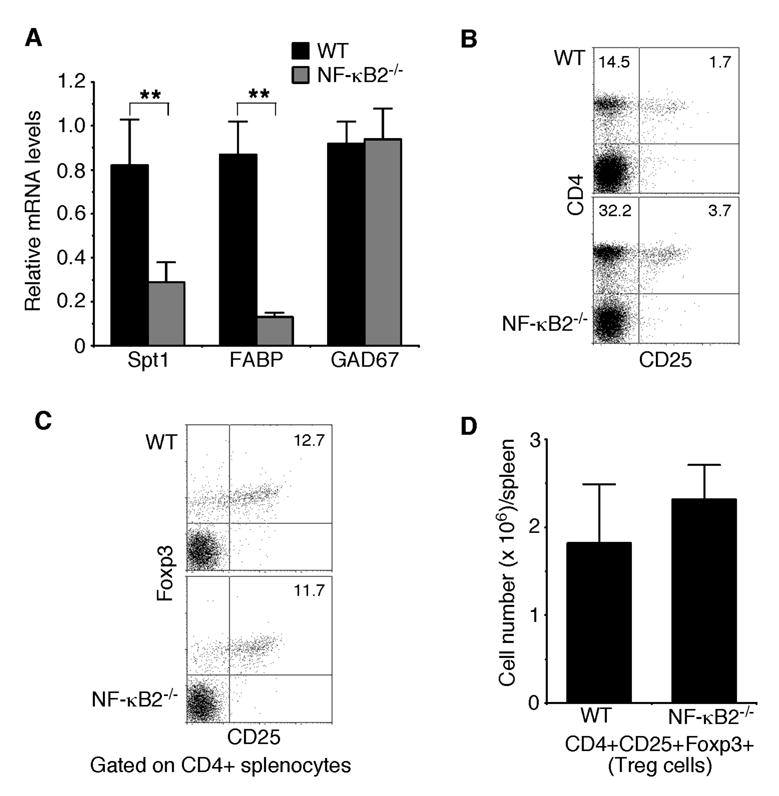
A, Real-time PCR analysis of the relative expression levels of three representative tissue-restricted self-antigens, Spt1, FABP, and GAD67. The highest expression levels of these antigens in wild-type mice are defined as 1.0. Data represent means ± standard deviations from 4 mice for each genotype. ** Student’s t-test, p<0.01. B, Flow cytometry analysis of CD4+CD25+ regulatory T cell populations in spleens of 4- to 6-week-old NF-κB2−/− and wild-type mice. Numbers indicate percentages of the CD4+ and CD4+CD25+ T cell populations. Data are representatives of 6 mice for each genotype. C–D, Flow cytometry analysis of CD4+CD25+Foxp3+ regulatory T cells in spleens of 4- to 6-week-old NF-κB2−/− and wild-type mice. The plots in C contain only the CD4+ cells in which percentages of the CD25+Foxp3+ T cells are shown. Data in D represent means ± standard deviations from 4 mice for each genotype.