
Figure 6. Comparative modeling of ACF.
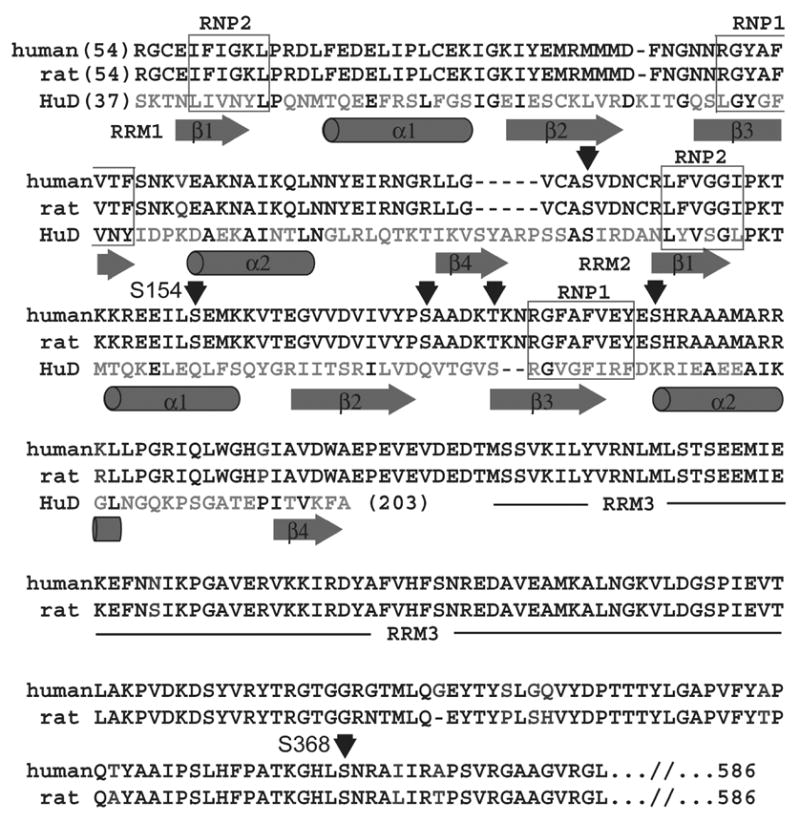
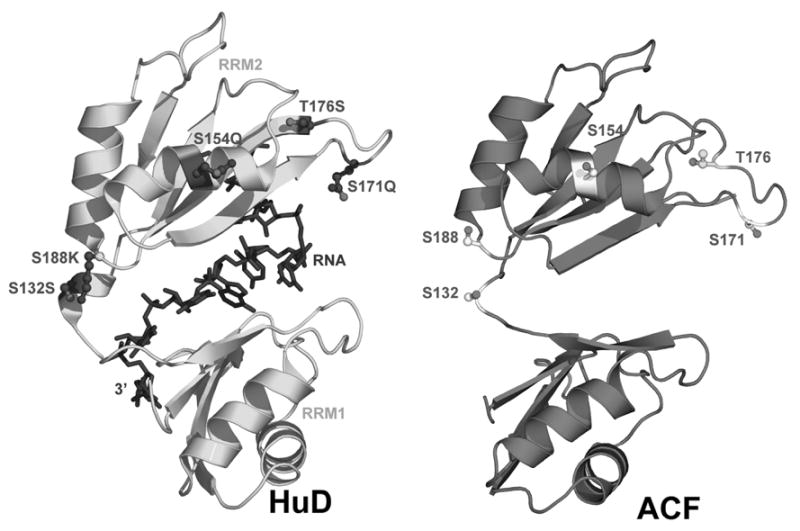
(A) Rat and human ACF sequence alignment and secondary structure prediction. The human ACF amino acid sequence is shown above that of rat. Black residue pairs are conserved; unique regions between ACF variants are blue and unique HuD residues are green. Red letters indicate contacts to HuD RNA. Arrows mark mutagenized residues. (B) Predicted tertiary structure of ACF and potential phosphorylation sites, provided alongside original HuD structure bound to substrate RNA. Figure 6B was made using PyMol [59].