
Figure 1.
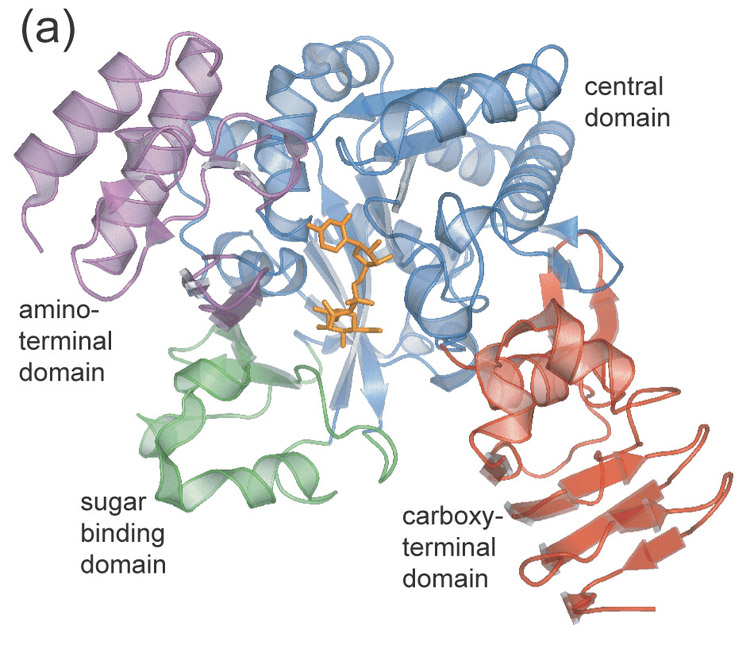
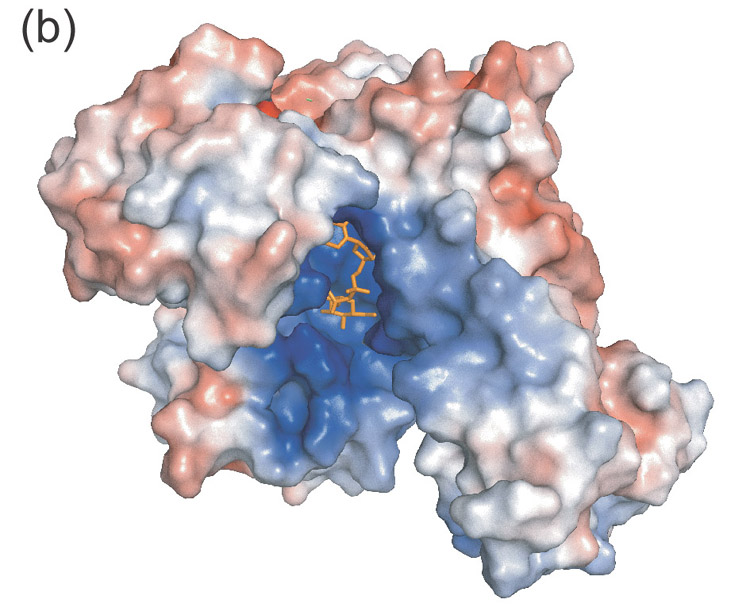
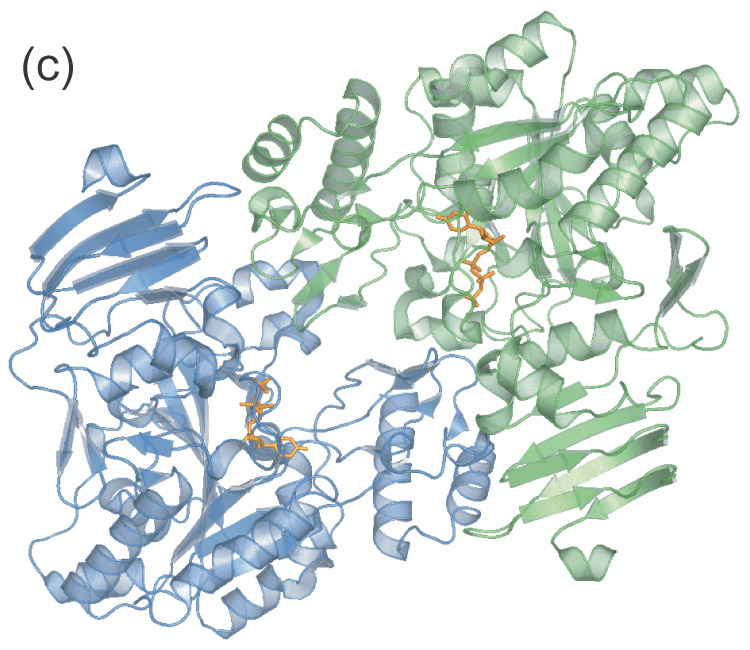
Fold of UDPGP. The substrate complexes (2icy/2icx) are used to illustrate the location of the active site and UDP-glucose/UTP is shown as orange stick model.
- Ribbon diagram of UDPGP monomer. Domains are color coded as follows: central domain (blue), carboxy-terminal domain (red), amino-terminal domain (magenta), sugar binding domain (green).
- Electrostatic surface diagram illustrating the positively charged substrate cavity.
- Apparent UDPGP dimer. The amino-terminal domain of each monomer resides near the active site of the other respective monomer.