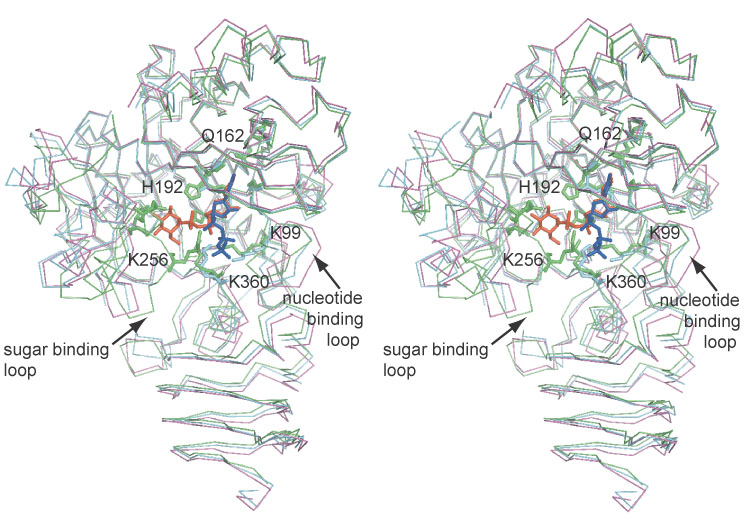
Figure 4.

Overlay of the native (magenta), UTP complex (cyan), and the UDP-glucose complex (green). The open and closed forms of the sugar binding and nucleotide binding loops are illustrated and the residues shown in Figure 3 are displayed as stick models. UDP-glucose and UTP are shown as orange and blue stick models respectively.
