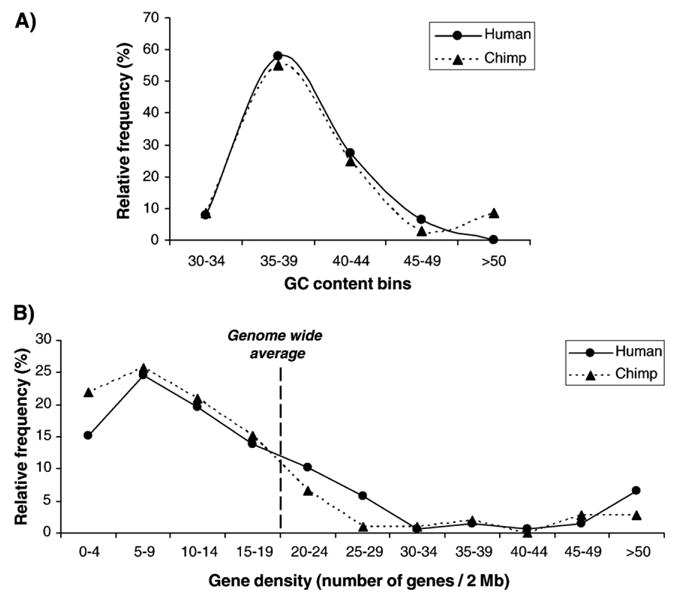
Fig. 5.

Analysis of genomic environment adjacent to species-specific L1 elements. (A) Analysis of GC content. The vertical axis represents the number of L1 loci within each GC bin. The highest frequency of species-specific L1 loci is shown in 35–39% GC bin from both the human and chimpanzee genomes. (B) Number of genes flanking L1 elements. The distribution of the number of genes flanking species-specific L1 elements is similar in both the human and chimpanzee genomes.
