
Fig. 5.
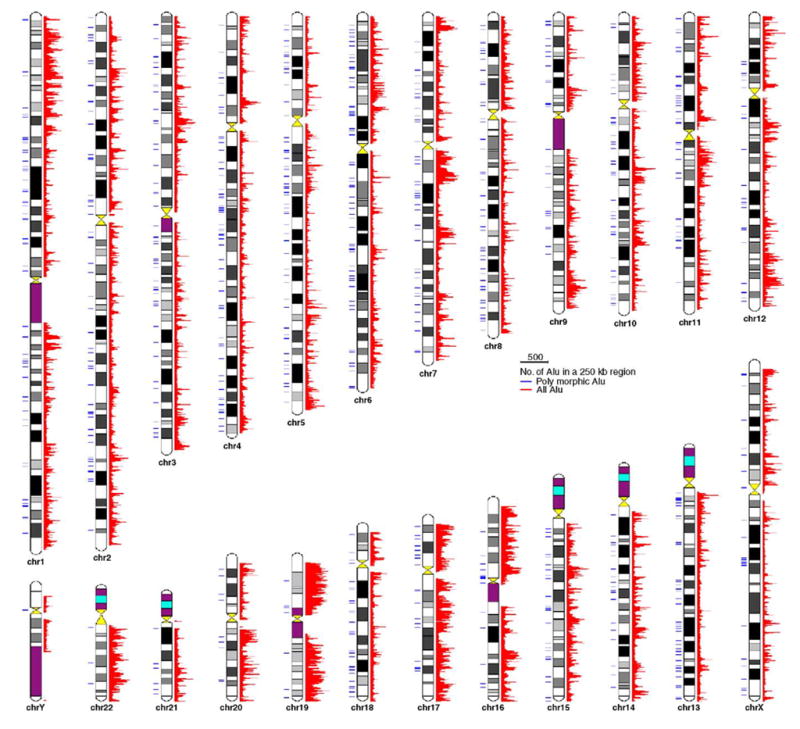
Genome-wide distribution of human Alu insertion polymorphisms. The 800 newly reported Alu insertion polymorphisms (blue) and all Alu elements from UCSC hg15 assembly (red) were plotted on the human chromosomal ideogram based on their physical locations. The “all Alu” track in red represents the number of Alu elements per 250 kb genomic region. (For interpretation of the references to colour in this figure legend, the reader is referred to the web version of this article.)