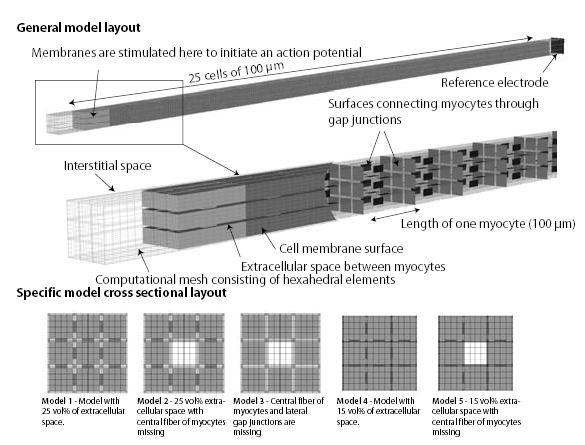
Figure 3.

The general layout of the tissue model used in simulations is depicted in top figure. The center figure depicts an opened model showing the cell membrane embedded in the interstitial space on the left and the locations of the gap junctions on the right.
Based on this general model six specific models were created with a different distribution of interstitial in the direction perpendicular to the fiber. These six different distributions are depicted in the lower figure.
