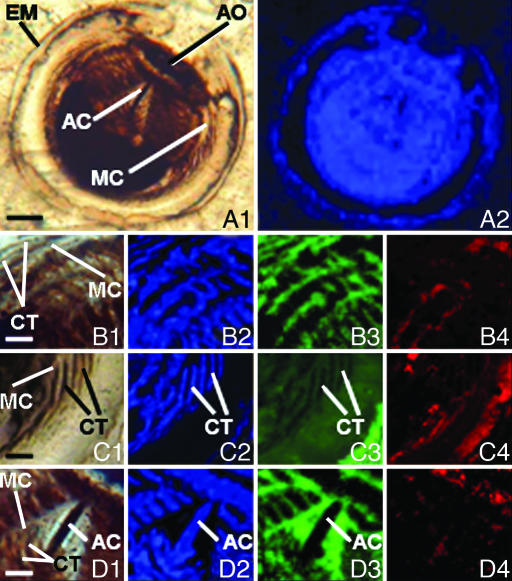
Fig. 1.
Optical and Raman images of a thin section-embedded ctenophore embryo from the Lower Cambrian Kuanchuanpu Formation of Ningqiang, Shaanxi Province, China. [Scale bars, 25 μm (A); 10 μm (B–D)]. The Raman images, obtained by recently documented techniques (11), are maps acquired in spectral windows centered on the major Raman bands of the materials analyzed in which varying intensities correspond to the relative concentrations of the molecular structures detected. The blue images (A2, B2, C2, and D2), acquired in a spectral window centered at ≈1,604 cm−1, show the spatial distribution of carbonaceous kerogen; green images (B3, C3, and D3), centered at ≈1,087 cm−1, show the distribution of calcite; and red images (B4, C4, and D4), centered at ≈965 cm−1, show the distribution of apatite. Optical image (A1) and Raman image (A2) of the complete embryo are shown in its kerogenous composition. AC, aboral canal; AO, apical (aboral) organ; EM, egg membrane; MC, meridional canal. Optical image (B1) and Raman images (B2–B4) of the upper left of the specimen (A1) show that it is composed of kerogen (B2) pervaded by fine-grained apatite (B4), the interstices between the structures thus preserved having been infilled by calcite (B3). Optical image (C1) and Raman images (C2–C4) of the middle-right of the specimen (A1) show that the comb plates (ctenes, denoted by CT) are composed of kerogen (C2) augmented by apatite (C4), spaces between them having been infilled by calcite (C3). Optical image (D1) and Raman images (D2–D4) are of the aboral pole of the embryo. AC, aboral canal.

