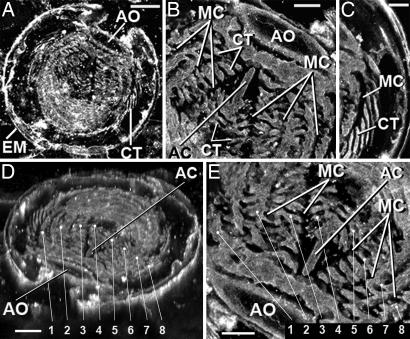
Fig. 3.
CLSM images of the thin section-embedded embryo, obtained by recently documented techniques (12). [Scale bars, 25 μm (A and D); 10 μm (B, C, and E)]. Because such CLSM images record the laser-excited fluorescence emitted by the kerogen that comprises such fossils, they provide a proxy for direct chemical analyses that show the carbonaceous composition of a specimen analyzed. (A) CLSM image of the complete embryo (see Fig. 1A). The aboral region (B) and middle-right region (C) (see Fig. 1C) of the specimen show the fine-scale morphological information provided by CLSM images. (D) Rotated CLSM image showing comb rows, numbered 1–8, that overlie meridional canals. (E) Higher-magnification image of the aboral region showing the numbered comb rows. AO, apical (aboral) organ; EM, egg membrane; CT, ctenes; AC, aboral canal; MC, meridional canal.

