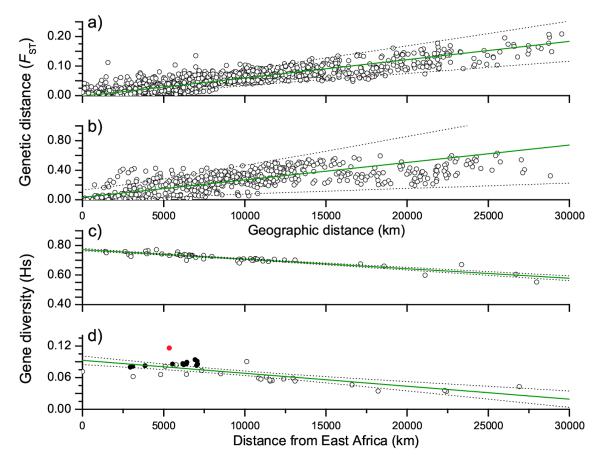
FIGURE 2.
Parallel geographic patterns of genetic diversity in humans (a,c) and H. pylori (b, d). a, b) Genetic distance between pairs of geographic populations (FST) versus geographic distance between the two populations. c, d) Average gene diversity within geographic populations (HS) versus geographic distance from East Africa. R2: a,0.77; b,0.47; c,0.85; d,0.59. In part d, samples that are predominantly composed of hpEurope isolates are indicated by filled circles while the red circle identifies the sample from South Africa. Confidence intervals are indicated by dotted lines.

