
Figure 2.
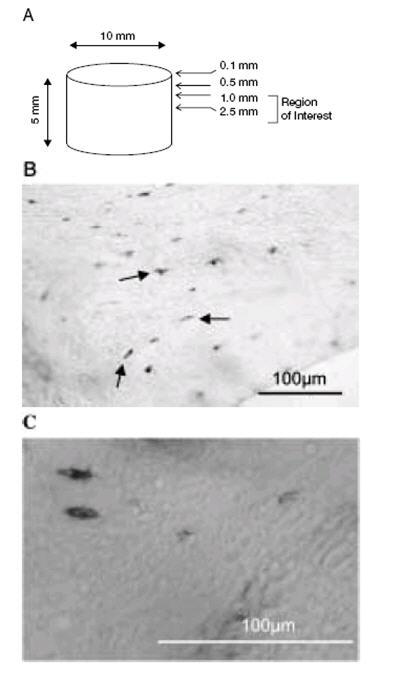
Cell viability as demonstrated by Lactate Dehydrogenase (LDH) Activity. (A) 7 μm cryo-sections were cut at distances of 0.1 mm, 0.5 mm, 1.0 mm and 2.5 mm through each 10 mm x 5 mm bone core (image not to scale). (B) A representative image showing LDH positive osteocytes stained dark blue in a cryo-section from a bone core maintained in the 3-D bioreactor system for 7 days and subjected to mechanical stimulation. (C) High power image of LDH positive osteocytes. Scale bar 100 μm.