
Figure 3.
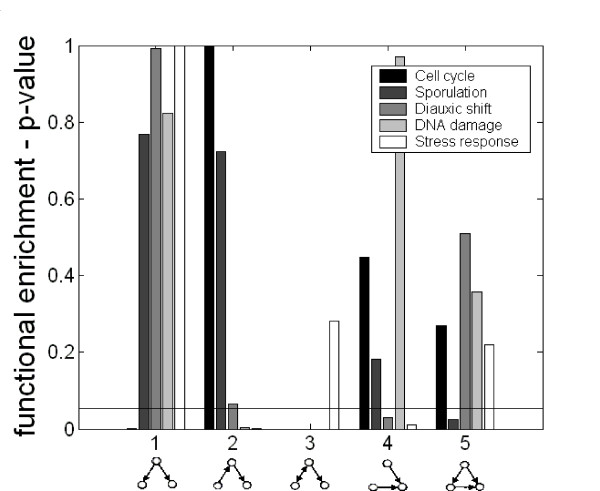
Functional enrichment of all 3-node patterns in each dynamic regulatory network. For each 3-node pattern in each condition we show the p-value obtained in a t-test comparing the mean functional enrichment score of the patterns with the corresponding score obtained for the remaining patterns (Methods). Patterns in specific conditions with p-value below 0.05 (marked with a horizontal line) are considered functionally enriched.