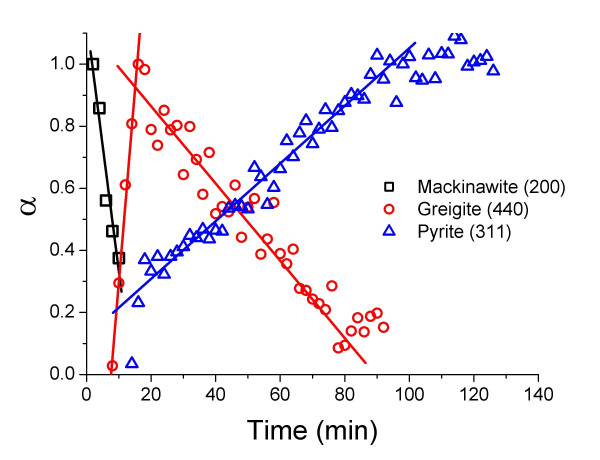
Figure 2.
Reaction progress (α) determined from the growth and decay of the diffraction peaks for mackinawite (200), greigite (440), and pyrite (311) as a function of time at 200°C. Reaction conditions are the same as in Fig. 1. Rate constants for mackinawite consumption (k-mack), greigite growth and consumption (k+grei and k-grei, respectively) and pyrite growth (k+pyr) were determined from the slopes of the fitted lines and are tabulated in Tab. 3. Error bars were omitted for clarity; mean errors in α : mackinawite (200) ± 0.203, greigite (440) ± 0.0633, pyrite (311) ± 0.0489.

