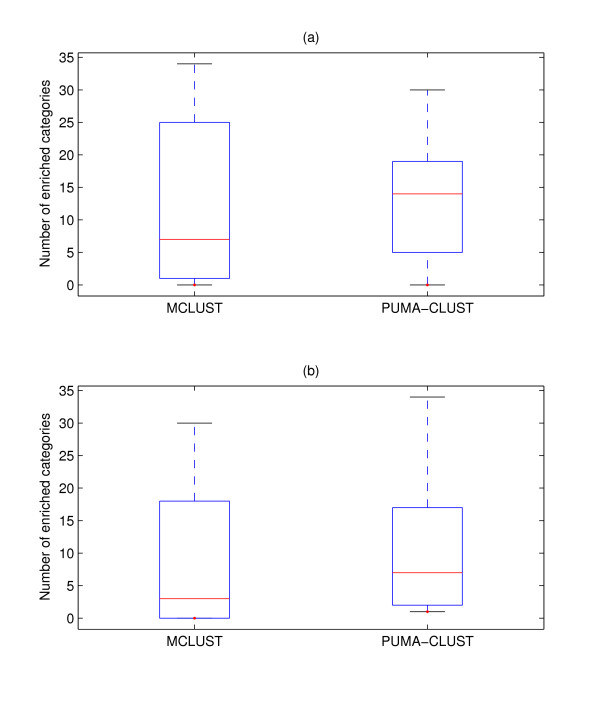
Figure 10.
Boxplot of the number of enriched categories for MCLUST and PUMA-CLUST clusters. Boxplot of the number of enriched categories for MCLUST and PUMA-CLUST clusters using (a) 22 clusters and (b) 30 clusters. The boxes show the lower quartile, median, and upper quartile values. The dotted lines show the extent of the rest of the data. The number of enriched categories for MCLUST has larger variance than that for PUMA-CLUST.

