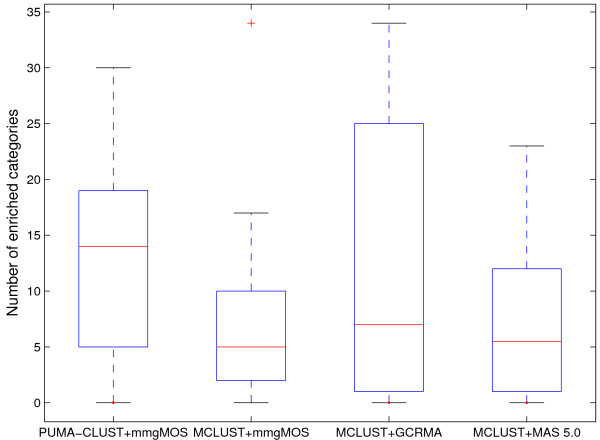
Figure 12.
Boxplot of the number of enriched categories for MCLUST and PUMA-CLUST clusters using various probe-level methods. Boxplot of the number of enriched categories for MCLUST and PUMA-CLUST clusters using various probe-level methods when K = 22. The boxes show the lower quartile, median, and upper quartile values. The dotted lines show the extent of the rest of the data.

