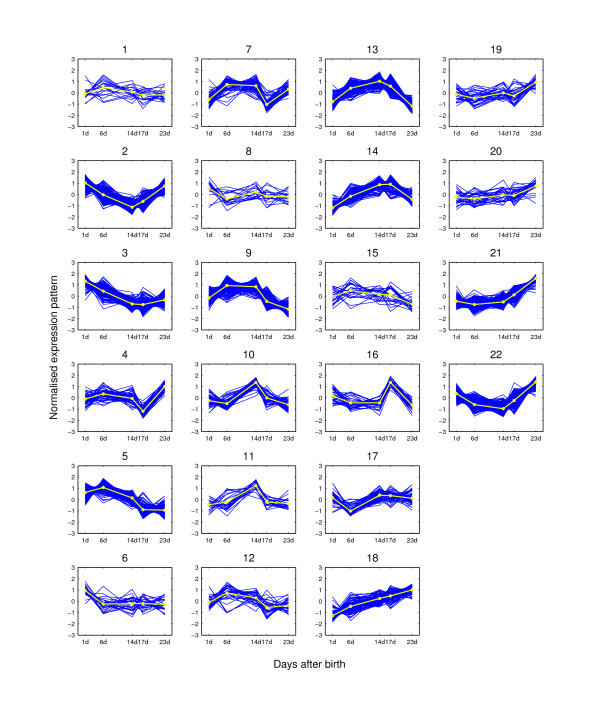
Figure 6.
Expression pattern clusters from MCLUST when K = 22. The clusters are for the 2,461 potential hair cycle-associated genes of the mouse time-course dataset when K = 22. The expression pattern for each probe-set is shown as dark lines for five time points. The light line on each plot is the clustering center for each group. At each time point, the expression value is the average of the three replicated measurements.

