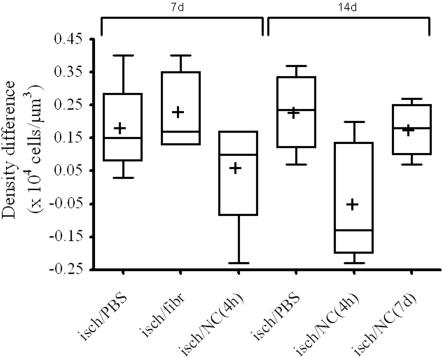
Figure 4. Box-plot of neuronal count performed in ischemic mice 7 and 14 days after ischemia with the optical dissector method.
Differences of neuronal density between contralateral and ipsilateral striata are sorted by treatment and time. The box represents the median and 25th–75th percentiles, whiskers represent the range, + represents the mean of the group. The hierarchical ANOVA showed a significant effect for the treatment (P = 0.02). The Bonferroni post-hoc test showed significant differences (P<0.05) among mean density differences of the isch/NC(4 h) group and the isch/PBS, isch/fibr and isch/NC(7 d) groups. Data plotted have been multiplied by 1×10⁴.

