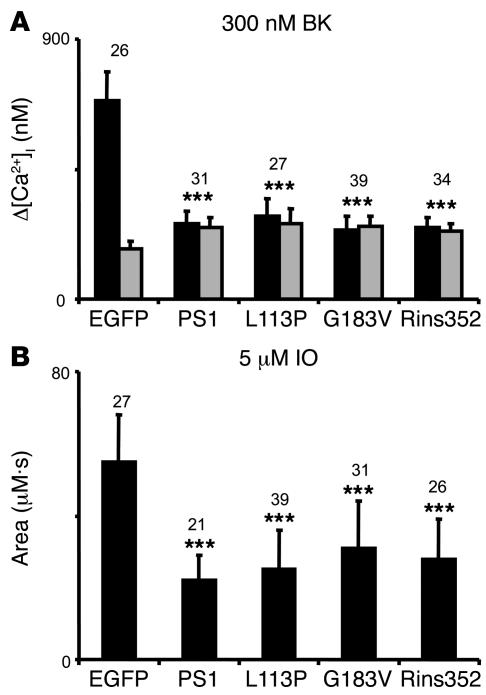
Figure 6. Summary of PS1-FTD rescue experiments.
(A) The average basal cytosolic Ca2+ levels (gray bars) and the amplitude of BK-induced Ca2+ responses (black bars) are shown as mean ± SD for DKO cells transfected with EGFP and PS1 expression constructs (the number of cells analyzed is shown above each set of bars). When compared with DKO cells transfected with EGFP alone, the basal Ca2+ levels were significantly higher and the amplitude of BK-induced Ca2+ response was significantly smaller in DKO cells transfected with EGFP+PS1, EGFP+PS1-L113P, EGFP+PS1-G183V, and EGFP+PS1-Rins352. (B) The average size of IO-releasable Ca2+ pool is shown as mean ± SD for DKO cells transfected with EGFP and PS1 expression constructs (the number of cells analyzed is shown above each bar). When compared with DKO cells transfected with EGFP alone, the size of IO-releasable Ca2+ pool was significantly smaller in DKO cells transfected with EGFP+PS1, EGFP+PS1-L113P, EGFP+PS1-G183V, and EGFP+PS1-Rins352 combinations. ***P < 0.05 by ANOVA.

