. 2006 Nov 14;3(1):51–59. doi: 10.1039/b613673g

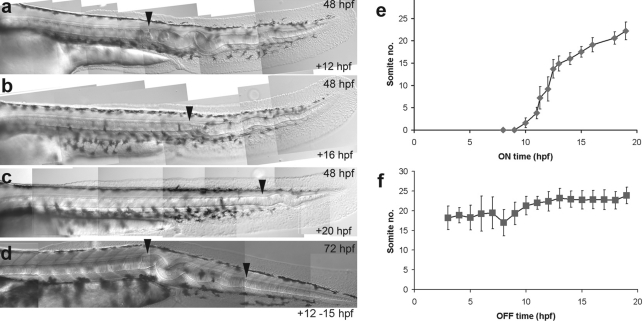
Fig. 4. Temporal control of notochord morphogenesis. The anterior boundary of the notochord defect (arrowhead) shifts in the posterior direction as the time of MCP 1 addition is delayed. 200 nM MCP 1 was added at (a) 12 hpf, (b) 16 hpf and (c) 20 hpf; all embryos were photographed at 48 hpf. (d) The relationship between the time of MCP 1 addition and the anterior boundary of the notochord defect is given as the adjacent somite number (mean ± s.d.). Embryos here were scored at 3 dpf. N for each time-point >10. (e) If MCP 1 added for a short time interval (12–15 hpf) and then removed, notochord defects are localised within restricted zone (demarcated by arrowheads), here shown in 3 dpf embryo. (f) If MCP 1 was present before 6 hpf, then removed at various subsequent time-points, the posterior boundary of the affected notochord region was shifted, although the rate of change was lower than for ‘ON graph’. N for each time-point >15.

Fig. 4