
Fig. 3.
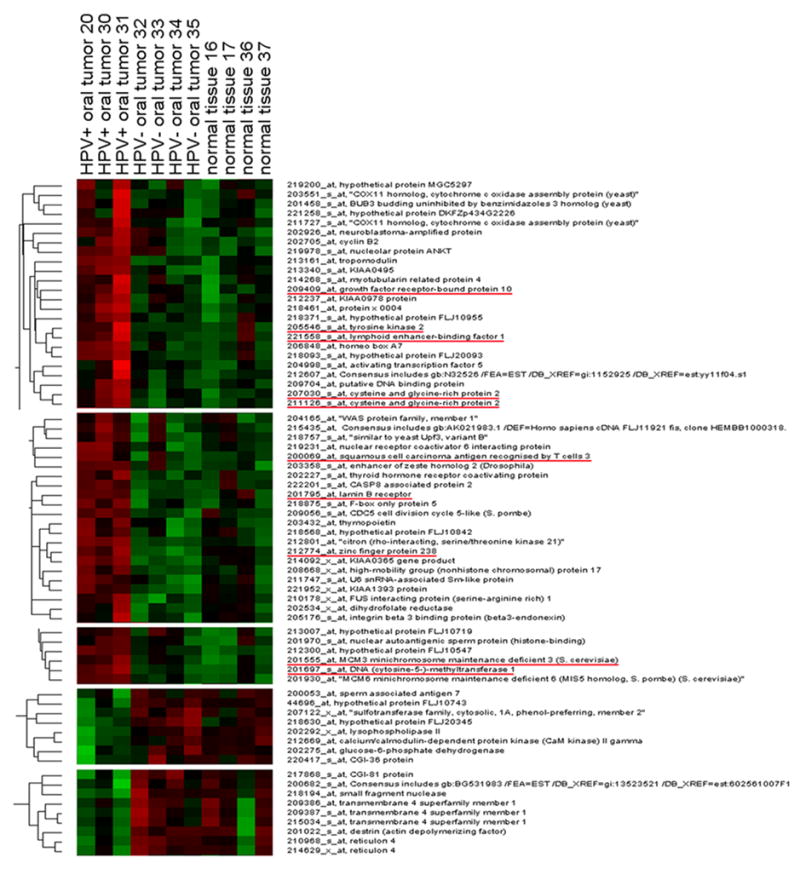
Unsupervised hierarchical cluster analysis in oropharyngeal tissue samples. From a total of 22,215 transcripts on the microarray, 8,286 genes showed variations in expression across all the samples. From this group of filter genes, we identified 7 clusters of genes that show differential expression between the 3 groups of samples (HPV-positive SCCHN, HPV-negative SCCHN and normal oral mucosa). Genes also found in the supervised statistical analysis are underlined.