
Figure 1.
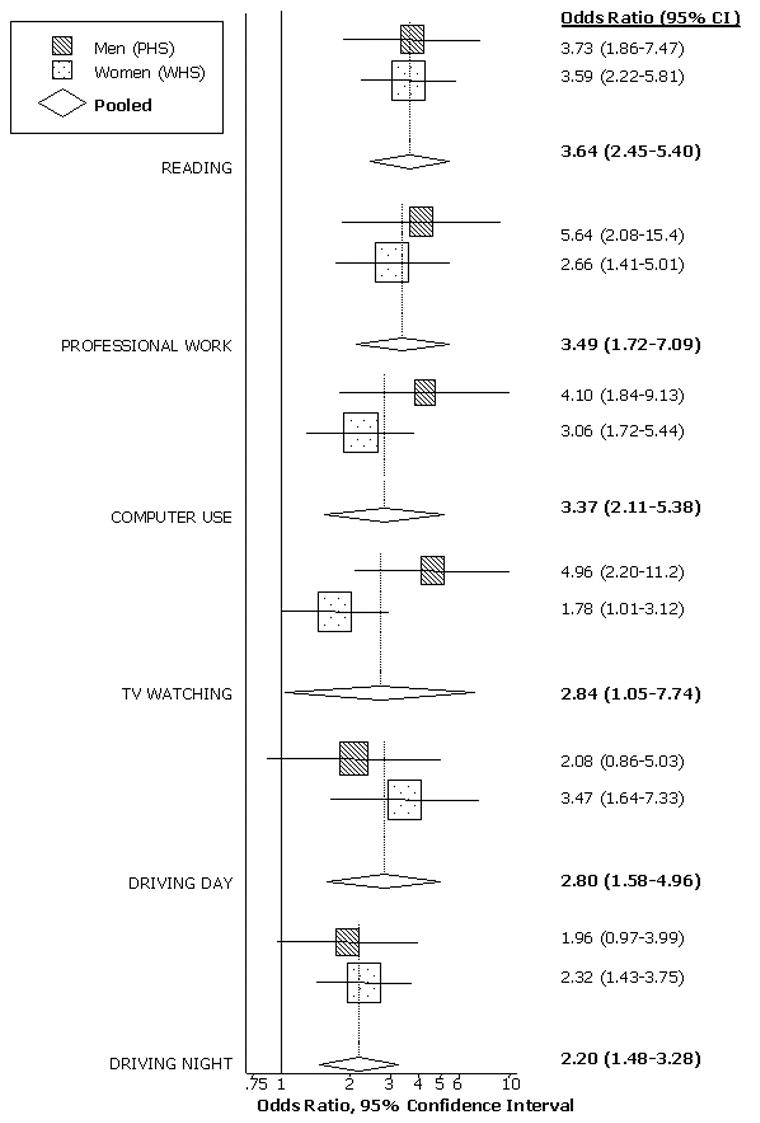
Presented are the separate and pooled results for the association between DES and reported problems with selected activities of daily living, adjusted for potential confounding factors. The center of each square indicates the odds ratio (OR), and the size of the square is proportional to the percent weight each study contributed to the pooled estimate. The horizontal line bisecting each square represents the 95% confidence interval for the OR. The random-effects pooled OR and 95% CI are indicated by the unshaded diamonds. Estimates greater than one signify that subjects with DES were more likely to report having problems with that particular activity.