
Figure 11. Linoleic acid induced cellular glutathione oxidation and loss.
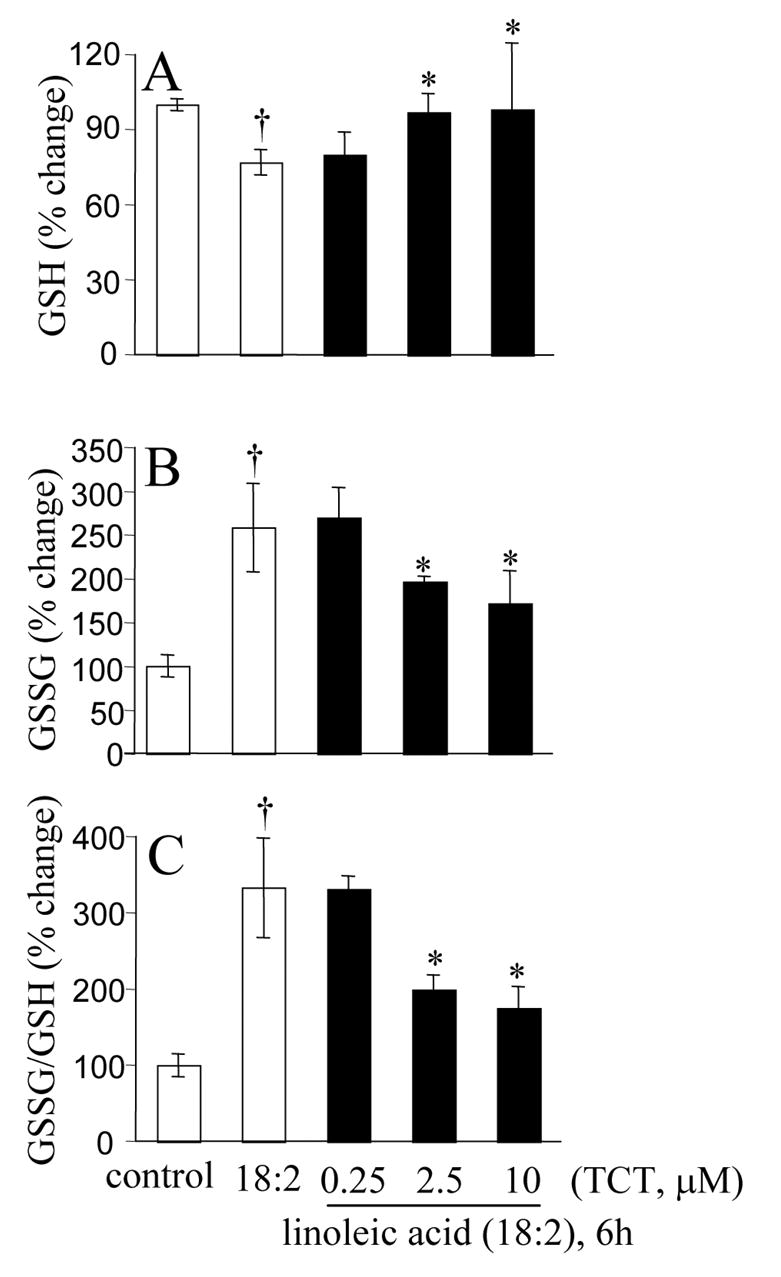
A, cellular GSH levels; B, cellular GSSG levels; C, cellular GSSG/GSH ratio as a marker of oxidative stress. †, higher than control (not treated with 18:2); *, significantly lower than in cells treated with linoleic acid alone. TCT, α-tocotrienol.