
Figure 6. Homocysteic acid induced cellular glutathione oxidation.
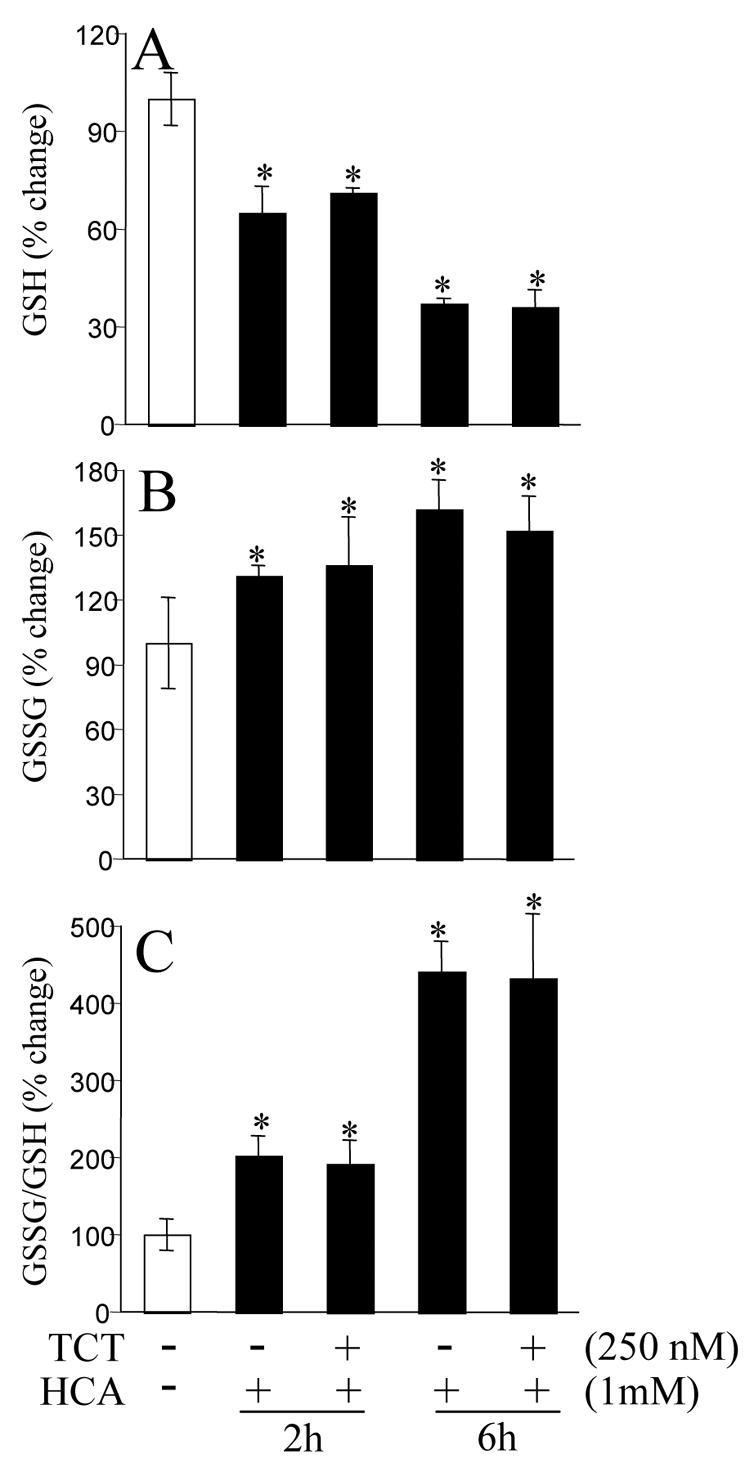
A, HT4 cell GSH levels; B, cellular GSSG levels; C, cellular GSSG/GSH ratio as a marker of oxidative stress. *, significantly different from cells not treated with HCA. TCT, α-tocotrienol.