
Figure 8. Homocysteic acid induced changes in [Ca2+]i and mitochondrial Δψ.
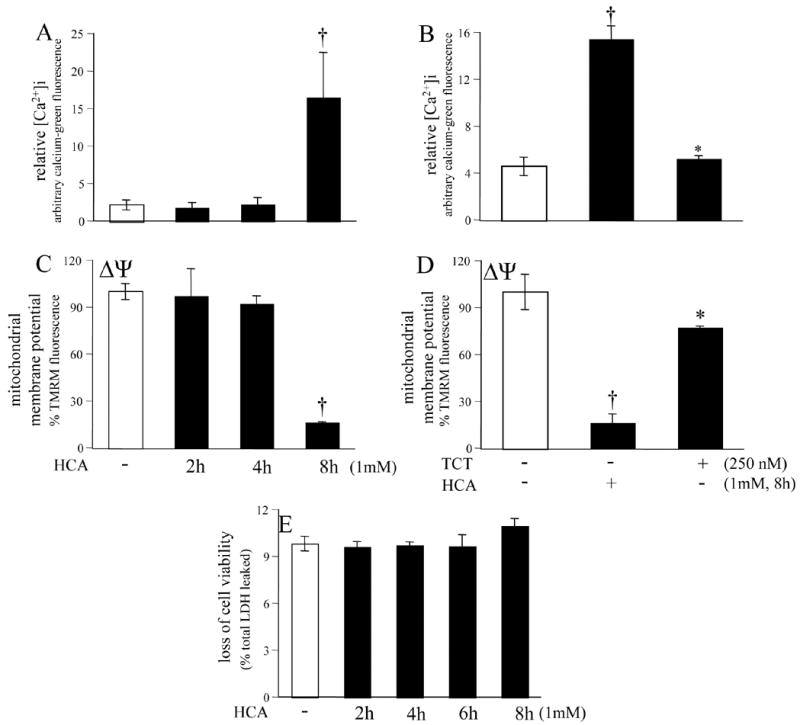
†, different than control (open bar); *, different than cells treated with HCA alone. TMRM, tetramethylrhodamine methyl ester. TCT, α-tocotrienol. E, there was no significant change in cell viability during the time frame studied.