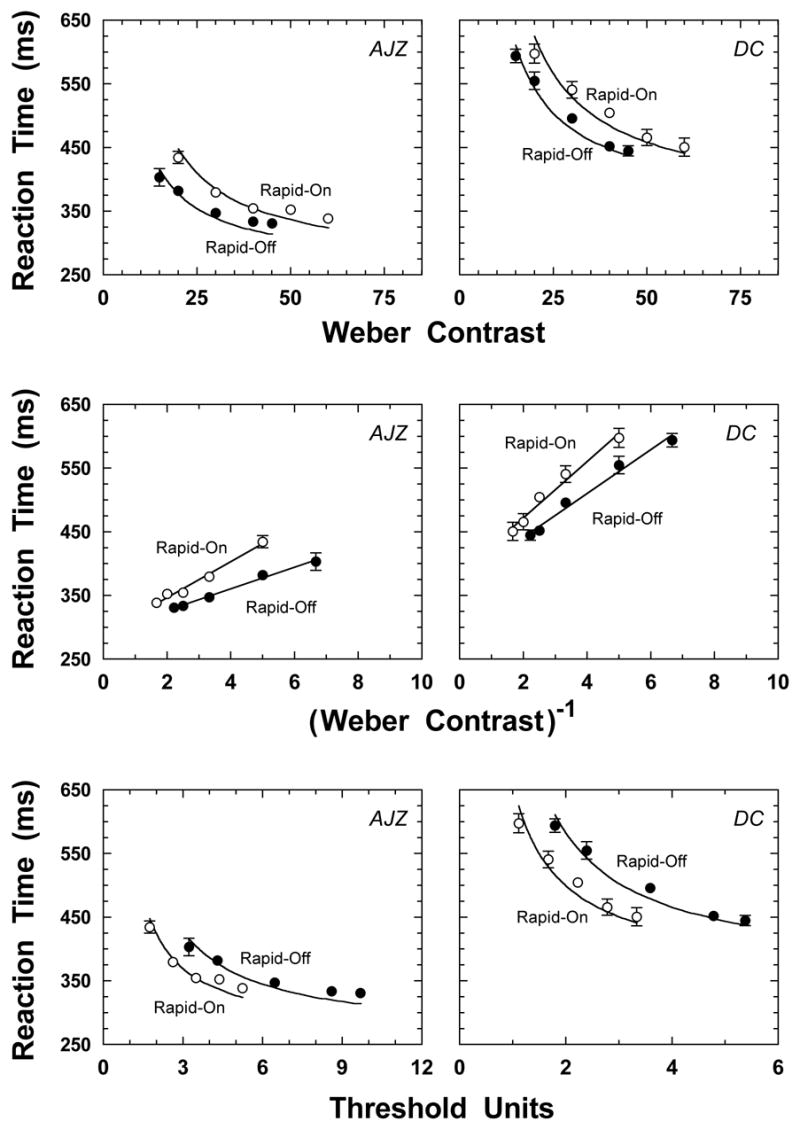
Figure 1.

The data in the upper panels show reaction time (ms) as a function of Weber contrast for two observers (left and right panels). The filled circles show the reaction times to a Rapid-Off ramp, the unfilled symbols show reaction time to a Rapid-On ramp. The middle panels show RT versus 1/contrast, a transform suggested by Plainis and Murray (2000). The data in the lower panels show reaction time as a function of the multiple of observer threshold. Note that the abscissas have different ranges due to individual sensitivity differences. The solid lines in upper and lower panels represent fits of the reaction time model described by Cao, Zele and Pokorny (In Press).
