
Figure 1. Gene expression relationships between groups of animals.
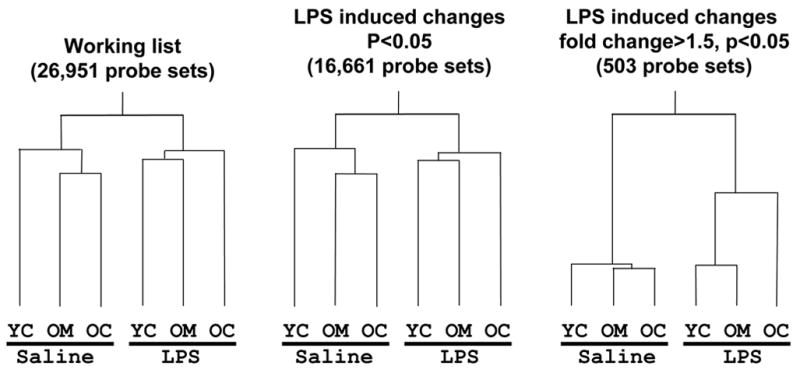
a condition tree built using a) the 'working list' of 26951 probe sets, b) 'significantly changed list,' of 16,661 probe sets, and c) 'LPS major changes list' of 503 probe sets, showing the degree of identity in relationships between different treatment groups. The Y-axis represents the estimated divergence in gene expression patterns, so that the longer each line is before bifurcation, the more remote the extent of relationship. YC = young control, OC = old control, OM = old melatonin.