
Figure 2. Comparative intensity of gene expression.
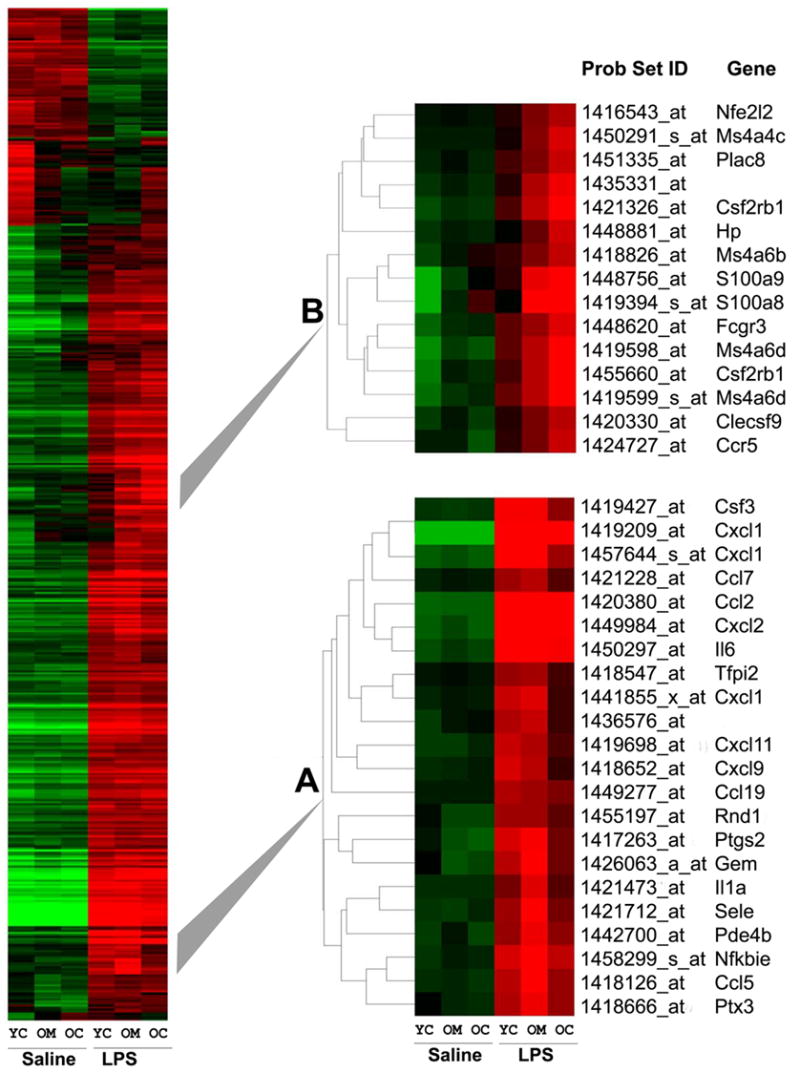
a heat map of the 'LPS major changes list' of 503 probe sets (>1.5 fold change, p<0.05) grouped using the gene tree algorithm according to similar expression patterns. Two gene clusters A and B whose response to LPS was altered by melatonin in the old animal are expanded and identified. Relative gene espression is represented graphically by coloring each cell corresponding to a particular gene (vertical axis) from an animal of a given age or treatment (horizontal axis). Genes with similar expression patterns are collected and displayed together in clusters. Cells with log ratios of 0.0 (genes unchanged) are colored black, increasingly positive log ratios (increased expression) with reds of increasing brightness, and increasingly negative log ratios (decreased expression) with greens of increasing brightness. YC = young control, OC = old control, OM = old melatonin.