
Figure 4.
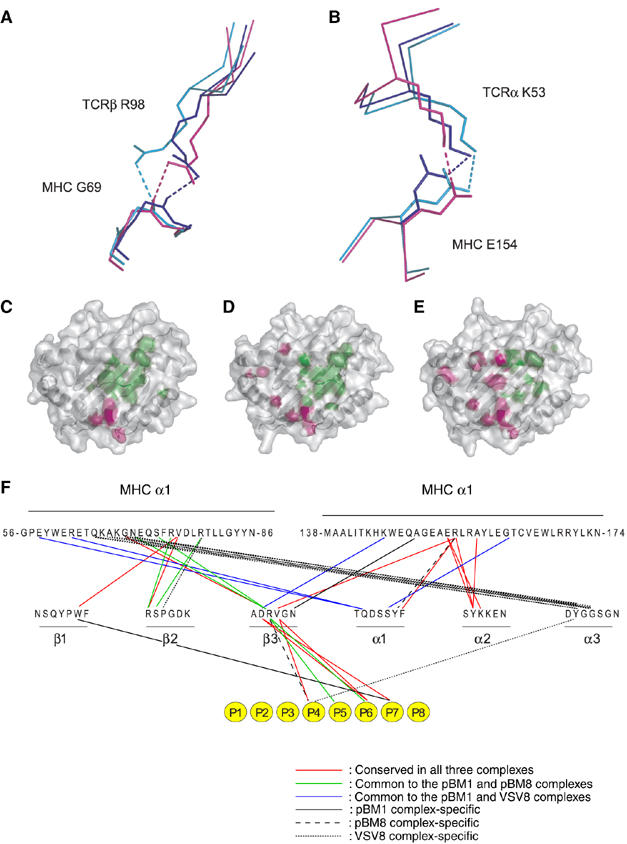
Comparison of BM3.3 docking onto the surface of the H-2Kb-pBM1, H-2Kb-VSV8, and H-2Kbm8-pBM8 complexes. (A, B) Close-up views of the two TCR-MHC hydrogen bonds conserved in the BM3.3-pBM1-H-2Kb (blue), BM3.3-VSV8-H-2Kb (magenta), and BM3.3-pBM8-H-2Kbm8 (cyan) complexes. (C–E) Views are looking directly onto the pMHC surface. Footprint of BM3.3 TCR on the VSV8-H-2Kb (C), pBM8-H-2Kbm8 (D), and pBM1-H-2Kb (E) surfaces. Peptide and MHC residues contacted by the TCRα chain or by the TCRβ chain are depicted in pink and green, respectively. The secondary structure of the MHC is apparent through the semitransparent surface. (F) Shared hydrogen bonding and van der Waals contacts between the BM3.3 CDRs and the three pMHC complexes. Interactions conserved in the three complexes are depicted in red. Shared interactions between BM3.3-pBM8-H-2Kbm8 and BM3.3-pBM1-H-2Kb, and between BM3.3-pBM1-H-2Kb and BM3.3-VSV8-H-2Kb are shown in green and blue, respectively. Interactions that are unique to either of the BM3.3-pBM1-H-2Kb, BM3.3-pBM8-H-2Kbm8 and BM3.3-VSV8-H-2Kb are depicted as continuous, dashed, or dotted lines, respectively. Also shown, using the same colour code, are the interactions between the BM3.3 CDRs and each residue of the bound octapeptide (depicted as yellow circles).