
Figure 7.
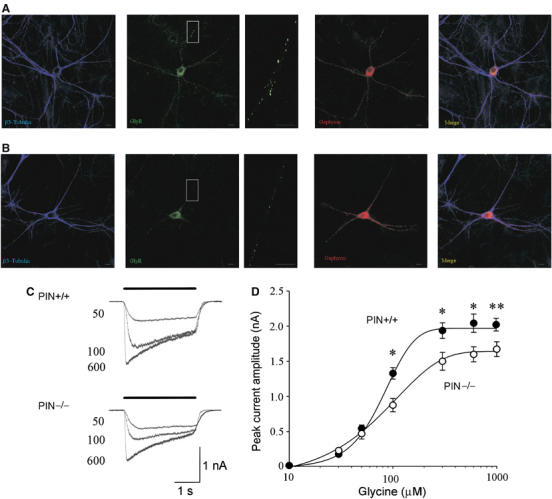
Hippocampal neurons from Pin−/− mice express a reduced number of GlyRs punctae associated with decreased peak amplitude of glycine-evoked currents. (A) Hippocampal neurons derived from Pin1 WT and (B) knockout mice were labelled with monoclonal antibody (mAb4a) recognising the GlyRs (green), polyclonal anti-gephyrin antibody (red) and the neuronal marker β3-tubulin (blue). Side panels are magnification of the boxed areas. Scale bars, 10 μm. (C) Superimposed current responses evoked at −40 mV by different concentrations of glycine (bar) in WT (PIN+/+, upper traces) and knockout (PIN−/−, lower traces) mice. The numbers near the current traces refer to the concentrations of glycine used (in μM). (D) Dose–response curve for glycine-evoked currents obtained in WT (filled symbols) and knockout mice (open symbols). Each point is the average of 8–16 individual responses (*P<0.05 and **P<0.001).