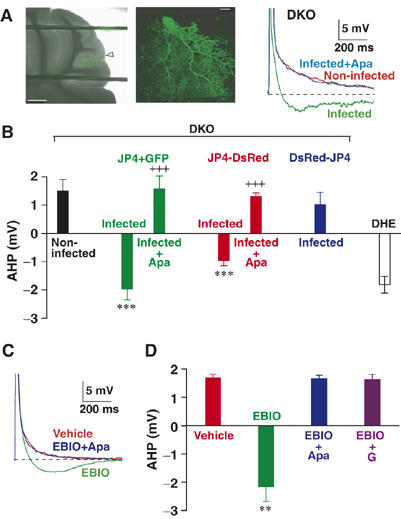
Figure 6.

Rescued sAHP in JP-DKO PCs. (A) (left and middle) Fluorescent images of PCs expressing JP4 and EGFP in cerebellar slice at different magnifications. The arrowhead indicates the site of penetration for viral injection. Scale bars, (left) 500 μm, (middle) 20 μm. (right) Representative traces of voltage response to CF stimulation recorded from JP-DKO PCs. sAHP was not observed in noninfected PCs, whereas apamin (Apa)-sensitive sAHP was rescued in infected PCs expressing both JP4 and EGFP. (B) Average amplitudes of sAHP. The data represent mean±s.e.m. (n=5, except for JP4+GFP-infected (n=8) and DHE PCs (n=11)). ***P<0.001, significantly different from the value for noninfected PCs in JP-DKO mice; +++P<0.001, significantly different from the value for apamin-untreated PCs expressing the same proteins. (C) Representative traces of voltage response to CF stimulation recorded from JP-DKO PCs. The bath application of 1-EBIO (1 mM) rescued apamin-sensitive sAHP. (D) Average amplitudes of sAHP. The data represent mean±s.e.m. (vehicle n=8, EBIO n=3, EBIO+Apa n=3, EBIO+thapsigargin (TG) n=5). **P<0.01, significantly different from the value for vehicle-treated PCs in JP-DKO mice. Data were obtained from 8- to 10-week-old mice.
