
Figure 4.
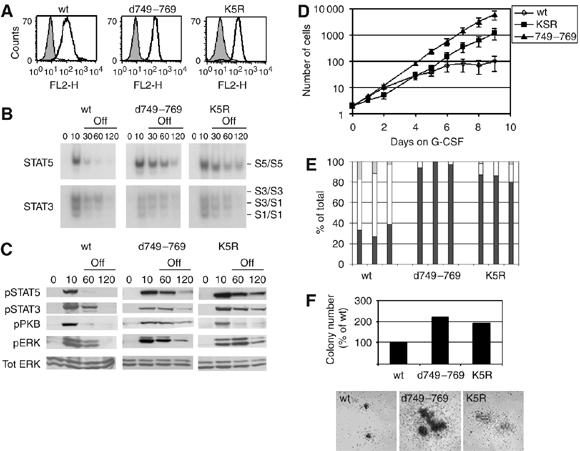
Role of internalization motif and cytoplasmic lysines in G-CSF signal attenuation and myeloid differentiation. (A) Flow cytometric analysis of membrane expression of wt, d749–769 or K5R G-CSFR in 32D cells. Bold histograms: cells stained with anti-G-CSFR and GAM-PE; shaded histograms: cells stained with GAM-PE only. (B) 32D cells expressing wt or mutant G-CSFR were deprived of IL-3 and serum for 4 h, incubated with G-CSF for 10 min at 37°C, washed and kept at 37°C in medium without factors. Nuclear extracts were assayed at the indicated time points by EMSA for activated STAT5 using β-casein oligonucleotides (C) Ba/F3 cells expressing wt or mutant G-CSFR were treated as described in (B) and lysates immunoblotted and stained with anti-pSTAT5, anti-pSTAT3, anti-pPKB, anti-pERK and restained with anti-ERK to verify equal loading. Results are representative of three independent experiments in different Ba/F3 clones. (D) Proliferation of 32D.cl8.6 cells expressing wt or mutant G-CSFR during 9 days of culture in the presence of G-CSF. Numbers of viable cells were determined at the indicated times. Data represent mean values±s.e.m. of three clones per construct. (E) Differential counts of cells taken from cultures shown in panel (D). On day 8, three clones per construct were analyzed and scored for percentages of blast cells (black bars), band forms (gray bars) or mature neutrophils (white bars). (F) G-CSF-induced colony formation by Csfr3−/− primary bone marrow cells after retroviral transduction of wt or mutant G-CSFR constructs. Upper panel: mean colony numbers per 25 000 infected bone marrow cells from triplicate colony assays. Lower panel: photomicrograph of representative colonies showing differences in colony size. Data are representative of two independent experiments. No G-CSF-induced colonies were observed with Csfr3−/− bone marrow cells transduced with empty vector.