
Figure 1.
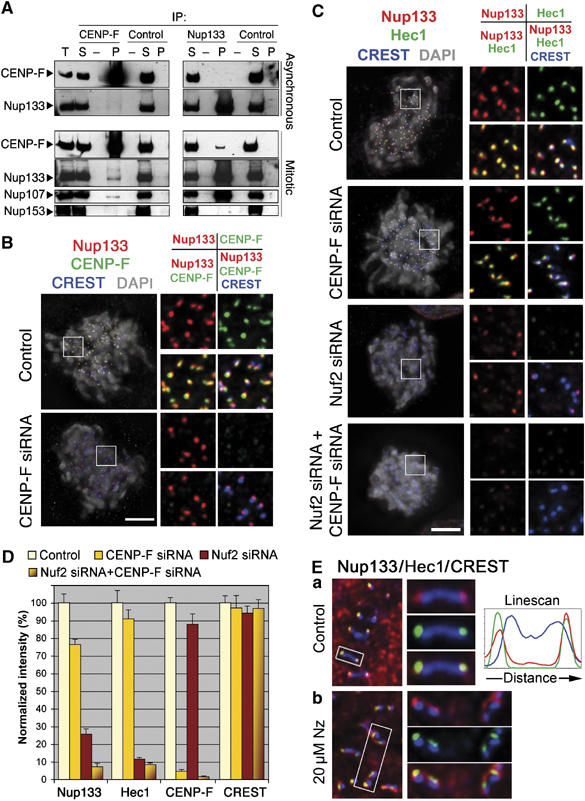
Nup107–160 complex targeting at kinetochores depends on CENP-F and the Ndc80 complex. (A) Immunoprecipitation of asynchronous or colchicine-arrested (mitotic) HeLa cell extracts using either anti-CENP-F or anti-myc (control) mouse IgG, or affinity-purified anti-hNup133 or anti-GST (control) rabbit IgG. Equivalent amounts of total extracts (T) and immune supernatants (S) and a 10-fold equivalent of the immune pellets (P) were analyzed by immunoblot using anti-CENP-F, anti-hNup133, anti-hNup107 and as control the mAb414 antibody that recognizes Nup153, a nucleoporin that does not belong to the Nup107–160 complex. Because of the lower amounts of CENP-F in asynchronous as compared with mitotic extracts, CENP-F immunoblots were exposed to yield comparable input signals. (B) HeLa cells treated for 3 days with control or CENP-F siRNA duplexes were pre-extracted, fixed and stained with anti-hNup133 (red), anti-CENP-F (green), CREST serum (blue) and DAPI (gray). (C) Cells treated for 3 days with control, CENP-F, Nuf2 or a combination of CENP-F and Nuf2 siRNA duplexes were processed for immunofluorescence as above using anti-hNup133 (red), anti-Hec1 (green), CREST serum (blue) and DAPI (gray). Maximum projection of deconvolved Z-stack images of all the four staining (left) or various combinations of overlay images (insets, right) is presented. Scale bar, 5 μm. (D) Quantification of the fluorescence intensity at kinetochores was performed as described in Materials and methods. (E) Single Z-plane of deconvolved immunofluorescence images from (a) control or (b) nocodazole-treated (Nz, 20 μM, 3 h) cells stained for Nup133 (red), Hec1 (green) or CREST antigens (blue). Right: enlargements of the marked areas stained with CREST and either Nup133 (top), Hec1 (center) or Nup133+Hec1 (bottom). Line scan through a single kinetochore pair, performed using the ‘Linescan' function accessed using the Metamorph software system, is also shown.