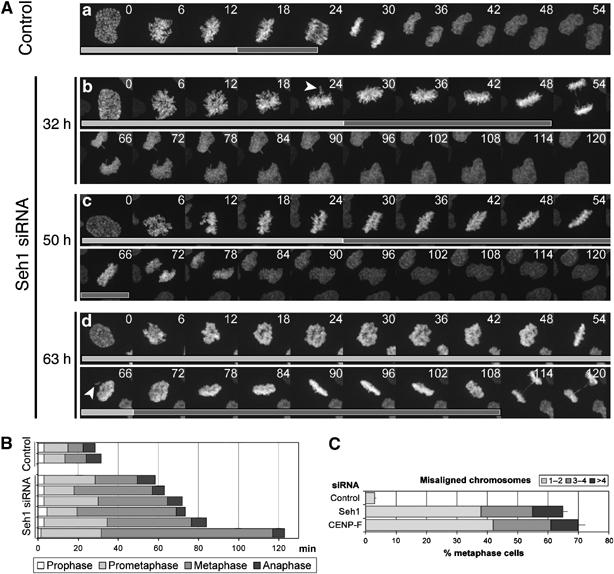
Figure 3.

Seh1-depleted cells display extended prometaphase and metaphase. (A) HeLa cells transiently expressing histone H2B-GFP were treated with control (a) or Seh1 (b–d) siRNAs. At 32 h (b), 50 h (c) or 63 h (d) after siRNA transfection, randomly chosen prophase cells were imaged every 90 s for several hours with a spinning disk confocal microscope. Maximum intensity projections of 14 Z-stack planes for each time point are presented. Arrowheads indicate misaligned chromosomes. Light gray bars indicate frames from prophase to metaphase, whereas dark gray bars outline time spent from metaphase to anaphase. (B) Mitotic progression in two control and six representative Seh1-depleted cells selected at random. (C) Quantification of misaligned chromosomes (defined as in Meraldi and Sorger (2005), as chromosomes located outside a rectangular area encompassing the central 30% of the spindle) in control, Seh1- or CENP-F siRNA-treated cells. The number of cells displaying 1–2 (light gray), 3–4 (dark gray) or >4 (black) misaligned chromosomes is expressed as percentage of total metaphase cells analyzed (at least 100 per condition).
