Figure 4.

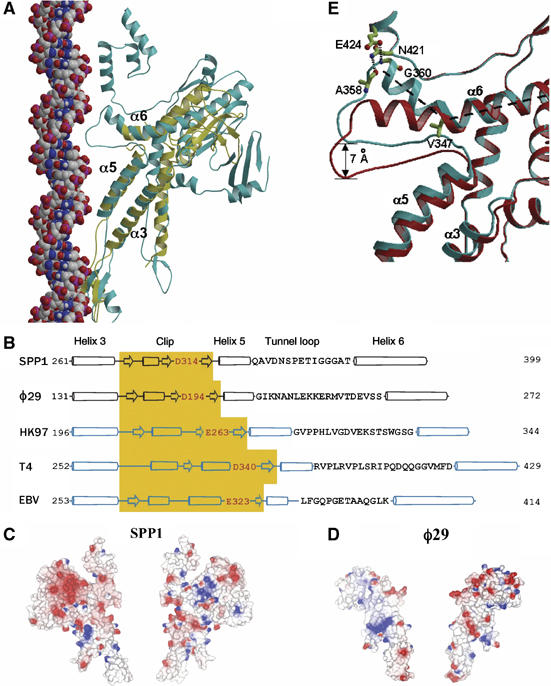
Structural conservation. (A) Single subunits of SPP1 (cyan) and φ29 (yellow) portal proteins are superimposed. B-form DNA (van der Waals model) is positioned along the tunnel to show the relative size and match between the tunnel loop and the major groove of the DNA. (B) Secondary structure alignment of the central part of the polypeptide chain, α3–α6. For HK97, T4 and Epstein–Barr (EBV) portal proteins predicted secondary structures are shown. The positions of α3–α6 segments were validated by a number of criteria described in Materials and methods; the negatively charged residue at the tunnel entrance is highlighted in red. Tunnel loop sequences are shown as single letter code; the length of the cylinders (α-helices) and arrows (β-sheets) are proportional to the predicted length. (C, D) Molecular surfaces of two opposing subunits of SPP1 and φ29 portal proteins colored according to electrostatic potential. (E) Two extreme states of the SPP1 tunnel loop: the cyan from the crystal structure with residues stabilizing the kinked conformation of helix α6 shown in ball and stick, and the red obtained by modeling a straightened conformation of this helix.
