
Figure 6.
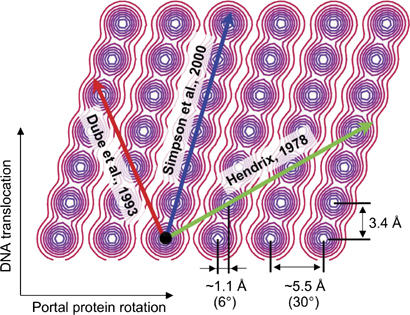
Energy landscape generated by the mismatching symmetries of portal protein and DNA. The X- and Y-axis correspond to the relative rotation and translation of the portal protein and the DNA, respectively. The relative scale on X and Y is such that distances on the drawing are proportional to those at the interface between the DNA and the tunnel loops. The energy minima form a periodic pattern. The horizontal separation between the minima corresponds to the observed 5.5 Å distance between the tips of the neighboring tunnel loops and the vertical separation corresponds to the 3.4 Å (1 bp) translation of the DNA. The combination of the two rotations (36–30°) effectively results in 6° horizontal angular separation between the minima, which corresponds to 1.1 Å horizontal displacement between the tips of the tunnel loops.